Thank you Abinash for coming up with a new challenge and thus something new to learn :)
I started solving it today, used references from google, applied certain code basics and was able to get the desired output.
Requirement:
With ref to example sheet as indicated in (Snapshot 1) which stores the list of class, names of students and their ages. Create an additional field which should hold the median value of the ages grouped by class. Basically with change in the filter, when the ages are displayed as per the filtered rows, the median of the visible ages should also change.
Snapshot 1: Understanding the requirement
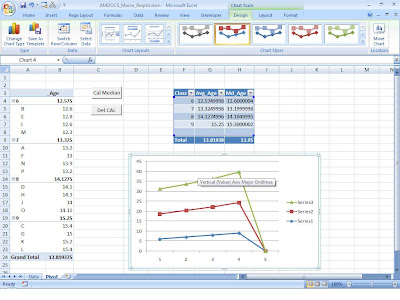
Snapshot-2: Knowing the solution frame-work
Snapshot-3: Observation of the result
1. click of the button Cal Median to get the desired result
2. Del CAL is used to delete the calculation and create chart.
The two buttons are added using Toolbox and are assigned macros MedianPT() and del_Chart() respectively.

Macro-code:
'---------------------------------------------------------------------------------------
'Calculation of Median (Class-wise) for a list of students
'Pivottable name -> Pivottable1
'Data in sheet "Data" name-> Table2 (It's a table and not a range)
'Result is populated in TABLE named -> Table1
'---------------------------------------------------------------------------------------
Option Explicit
Sub MedianPT()
Sub MedianPT()
Dim n As Integer, i As Integer, p As Integer, dt_total As Integer
Dim sr As Integer, k As Integer, j As Integer
Dim m As Single
Dim a As Variant, b As Variant, ps As Variant
Dim st As Range
Dim nn As PivotItem, pivt As PivotItem
k = 1
k = 1
i = 1
p = 1
On Error GoTo 0
Application.ScreenUpdating = False
Sheets("Data").Activate
Sheets("Data").Activate
With Sheets("Data")
With .Range("Table2")
dt_total = .Rows.Count
End With
Sheets("Pivot").Activate
Sheets("Pivot").Activate
With ActiveSheet.PivotTables("PivotTable1")
.PivotCache.Refresh
.PivotCache.MissingItemsLimit = xlMissingItemsNone
sr = .PivotFields("Class").PivotItems.Count
ReDim ps(sr)
For n = 1 To sr
Set pivt = .PivotFields("Class").PivotItems(n)
If pivt.Visible = True Then
ps(k) = pivt.Name
k = k + 1
End If
Next n
ReDim a(dt_total, k - 1)
End With
With ActiveSheet.ListObjects("Table1") ' delete Previous Content
ReDim a(dt_total, k - 1)
End With
With ActiveSheet.ListObjects("Table1") ' delete Previous Content
.ListColumns(2).DataBodyRange.ClearContents
.Range.RemoveDuplicates Columns:=2, Header:=xlYes
.ListRows(1).Range.ClearContents
.Resize .Range.Resize(sr)
.Resize .Range.Resize(k + 1)
For n = 1 To k - 1
.ListColumns(1).DataBodyRange.Cells(n) = ps(n)
Next n
End With
With ActiveSheet.PivotTables("PivotTable1")
With ActiveSheet.PivotTables("PivotTable1")
On Error GoTo errDo
For j = 1 To k - 1
For Each nn In .PivotFields("Name").PivotItems
a(i, p) = .GetPivotData("_Age", "Class", ps(j), "Name", nn)
i = i + 1
Next nn
ReDim b(i)
For n = 1 To i - 1
b(n) = a(n, p)
Next n
m = Application.WorksheetFunction.Average(b)
Sheets("Pivot").Range("Table1[Avg_Age]").Cells(p) = m
m = Application.WorksheetFunction.Median(b)
Sheets("Pivot").Range("Table1[Md_Age]").Cells(p) = m
p = p + 1
i = 1
Next j
End With
On Error GoTo 0 'reset
On Error GoTo 0 'reset
m = Application.WorksheetFunction.Average(a)
ActiveSheet.ListObjects("Table1").ShowTotals = True
Range("Table1[[#Totals],[Avg_Age]]").Select
Range("Table1[[#Totals],[Avg_Age]]").Formula = "=" & m
Range("Table1[[#Totals],[Avg_Age]]").Select
m = Application.WorksheetFunction.Median(a)
Range("Table1[[#Totals],[Md_Age]]").Formula = "=" & m
End With
ActiveSheet.Shapes.AddChart.Select
ActiveChart.SetSourceData Source:=Range("Pivot!Table1")
ActiveChart.ChartType = xlLineMarkersStacked
Range("A1").Select
Exit Sub
errDo: i = i - 1
Resume Next
End Sub
Resume Next
End Sub
Sub del_Chart()
Dim ch
ActiveSheet.ListObjects("Table1").ShowTotals = False
If ActiveSheet.ChartObjects.Count <> 0 Then
For Each ch In ActiveSheet.ChartObjects
ActiveSheet.ChartObjects.Delete
Next
Else
MsgBox "No Chart !!"
End If
With ActiveSheet.ListObjects("Table1")
.ListColumns(2).DataBodyRange.ClearContents
.Range.RemoveDuplicates Columns:=2, Header:=xlYes
.ListRows(1).Range.ClearContents
End With
End Sub
Please check the SnapShot for the data that I have:


No comments:
Post a Comment